Technical analysis is based on three underlying assumptions:
- The market discounts everything
- Price moves in trends
- History tends to repeat itself
WHO IS RESPONSIBLE FOR TECHNICAL ANALYSIS?
Many individuals, primarily scholars. A great deal of successful traders over the last century or longer have dissected markets and analyzed them from about every angle imaginable and have utilized a slew of data to create indicators that are designed to outline the market data in a way that’s more ‘digestible’.
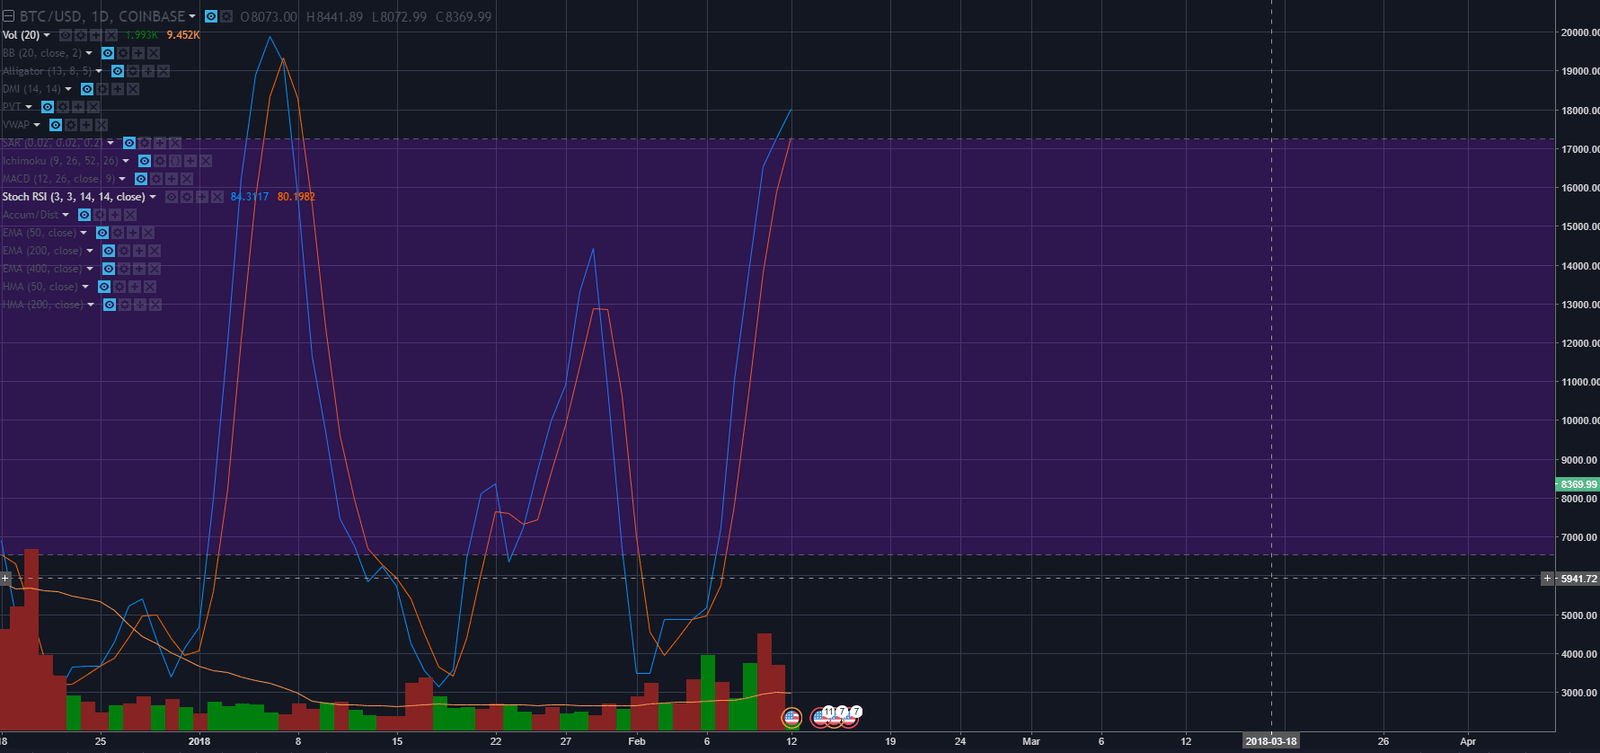
This indicator is called the ‘Stochastic RSI’. This indicator does not tell us anything that is not directly available through the price points on the chart. However, its advantage is that it synthesizes the information to give us an idea of whether the recent run of prices has risen well beyond what the prior existing trend dictated. Thus, the indicator is able to tell traders when it is indicating ‘oversold’ or ‘overbought’.
- Indicators: Technical tools based on mathematical computations of historical price and volume to assist in predicting future price movements
- Oversold: A situation where an asset is trading way below its intrinsic (true) value, usually due to panic selling or market overreaction. This is the best time to invest since the asset is cheap relative to its actual value
- Overbought: A situation where an asset is trading way above its intrinsic (true) value, without being supported by fundamental reasons. For instance, a coin’s price multiplying without any increase of its usage (or utility). This is the best time to sell away since the asset is too expensive and a pullback is expected.
Using this technical indicator, it becomes significantly easier to determine whether or not it is a wise choice to invest in a specific cryptocurrency. For example, in the picture above, the indicator is close to signalling that the price for the cryptocurrency is currently ‘overbought’. An educated trader would look at the indicator above and interpret that this means that the value of the cryptocurrency has risen well beyond what the market indicated that it valued it just a few days prior. Thus, there’s a chance that the market may ‘adjust’ or ‘correct’ in order to reach an ‘equilibrium’.
Despite the strong ‘signal’ coming from the above hypothetical indicator, a smart trader would look at a number of other indicators before making a definitive trade. (Read also: Cryptocurrency Trading: Understanding Cryptocurrency Trading Pairs & How it Works)
HOW WILL I KNOW WHAT TO DO?
So, you probably have a lot of questions, like:
- ‘How Do I Learn How to Use These Indicators?’
- ‘Where Do I Find These Indicators to Use Anyway?’
- ‘How Will I Know Which Combination of Indicators to Use?’
- ‘What’s a ‘Signal’?’
While this all seems overwhelming at first, you’ll get the answer to all of these questions in due time. How? By reading through our entire series on technical indicators.
(Read also: Understanding Cryptocurrencies: Game of Thrones Edition)
However, there are a number of myths that we need to ‘put to bed’ first.
- There is no ‘miracle’ algorithm for analyzing a security/cryptocurrency that is going to tell you exactly what’s going on. Certain individuals that have met technical analysts often ask questions such as, “When is ____ going down?” or “Should I invest here?” – Remember this: Technical Analysis are the tools, but their value is determined by their user. It is also useful to understand the differences between cryptocurrencies and tokens.
- Temper your expectations. Technical analysis will not give you a crystal ball, but it will help you to determine the general direction that a security/stock/cryptocurrency will travel in. Here’s a guide to understanding the difference between cryptocurrencies and stocks
- No matter how much reading you do, you have to practice. When you think you have it, practice some more. Apply the analysis that you learn to as many different coins/stocks/securities that you can find
- Possess a thirst for knowledge. Never stop reading and learning about this stuff. Learn to love it. This isn’t something you’re going to read for a couple seconds and just master randomly. This is a skill, and as such, you need to feed it
- Be prepared to contribute. Sure, there are already financial analysts and PhDs that have shelled out theories and ideas for years, but that doesn’t mean you can’t contribute. Learn how these indicators work and break them down to a science. Then reconstruct them. You’ll be surprised what you come up with